


The Matrix Map Approach Part One: How to Create the Matrix Map
You may have heard of the Dual Bottom Line: the idea that strategic choices must serve both mission impact and financial viability. But how do you turn this idea into a quantitative decision-making tool?
You may have heard of the Dual Bottom Line: the idea that strategic choices must serve both mission impact and financial viability. But how do you turn this idea into a quantitative decision-making tool?
Blue Avocado columnist Steve Zimmerman summarizes the Matrix Map approach in part one of this two-part article adapted from the book he co-wrote with Jeanne Bell and Jan Masaoka: Nonprofit Sustainability: Making Strategic Choices for Financial Viability.
A Matrix Map plots all of an organization’s activities into a single, compelling image.
It’s easy to embrace the concept of the Dual Bottom Line, but harder to apply it in a real-world board setting. For example, board members — and many staff — are seldom familiar with all of the programs and activities of the organization. While there may be a strong sense that “all our programs are great,” there may not have been any discussion about which programs are, in fact, those with the greatest or most important impacts. Even people with financial expertise may feel uncertain about how to make decisions that are more nuanced than “stick to the budget and at least break even.”
Board meetings unintentionally support this kind of fragmentation. They take each subject on its own: first the financial report, then the program report, and then the fundraising report. The Matrix Map aims to change that.
The Matrix Map is a visual tool that plots all of the organization’s activities — not just its programs — into a single, compelling image. By illustrating the organization’s business model — through a picture of all activities and the financial and mission impact of each one — it supports genuinely strategic discussions.
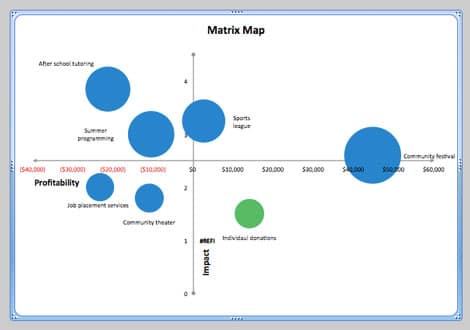
Below is an example of a Matrix Map for a community center. Each circle represents a business line. You can see that circles higher on the map have higher impact than those lower on the map. You can see the relative size of each activity, and which ones make money, which break even, and which require subsidy from the organization’s unrestricted funds.
The resulting image often provides an “Aha!” moment for board members. After years of hearing about seemingly unrelated programs, they can now understand how they all work together to support the impact and viability of the organization they care about.
How to make a Matrix Map of your organization
To create a Matrix Map there are four steps:
- Identify your “lines of business” or activities
- Assess relative mission impact
- Determine profitability and
- Map the results!
Here is a more thorough explanation of each step:
1. Identify your business lines — all of them
A business line is a programmatic or fundraising activity in your organization that requires effort. Counseling, dance performances, citizenship classes, and forest restoration are all business lines. A fundraising phone-a-thon is a line of business, as is a special event or major donor solicitation.
2. Assess relative mission impact
In many nonprofits, there’s an implicit assumption that all programs are effective and important — and that’s typically true. But everyone also realizes — yet seldom says — that some programs have higher impact than others. We may not discuss impact levels in order not to sound as if we are criticizing a worthwhile program (or its director), but it’s precisely these judgments — about which programs have the highest impact – that the management team and the board should discuss as strategic choices are made.
Each organization will have different criteria for impact — after all, impact is defined by each nonprofit differently. And remember, this is an informed self-assessment, not an evaluation. We suggest a survey or discussion with the management team and the board that asks individuals or the group to rate each business line on a scale of 1 to 4 using four criteria. Organizations can identify their own criteria for impact; here are a few we’ve found useful:
- Alignment with core mission: How closely does this program align with our core goals? Some programs may be excellent, but not as central to our mission.
- Excellence in execution: Organizations are simply better at delivering some activities than others. A business line may be important to our mission, but we may not have the right skills or financial resources to implement it with excellence. This is a nice way of separating planning from execution.
- Scale: How many people does each business line affect?
- Depth: How deep an intervention or contact does each business line provide?
- Building community or constituency: How does this business line contribute to building, for example, the environmental movement or the Hillside Neighborhood (not just our organization)?
- Fills an Important Gap (FIG): If a business line were to go away, would your constituents be able to go across the street to another agency or would they have nowhere to go?
Remember, you only need to choose four or five criteria and you don’t need to use any of these suggestions. After you’ve rated all of the business lines, take an average of the scores each line receives across the criteria and that will be its mission impact score. For example, if tutoring were to receive the following scores:
- Alignment with Impact: 4
- Excellence in Execution: 3
- Fills an Important Gap: 3
- Building Community or Constituency: 2
The mission impact score would be the average: 3.0.
3. Determine the profitability of each business line
Look at how much a business line is contributing financially (profit) or how much it needs subsidy from the organization’s unrestricted funds (loss). (Unrestricted revenue should be attributed to the fundraising vehicle [business line] that was used to raise it, such as major donors or direct mail.)
| After school tutoring | Sports league | Summer programming | Community Festival | Job placement servies | Individual donations | Community theater | Admin | Total | ||
| Revenue | 41,488 | 60,590 | 56,473 | 145,258 | * | 40,750 | 15,000 | 359,559 | ||
| Direct Expense | 51,360 | 49,500 | 52,890 | 79,500 | 17,860 | 21,052 | 22,000 | 36,251 | 330,413 | |
| Shared Costs | 5,802 | 2,800 | 7,320 | 9,750 | 2,560 | 2,450 | 1,132 | 2,123 | 33,937 | |
| Administration | 5,608 | 5,697 | 6,782 | 11,331 | 2,809 | 3,305 | 2,842 | (38,374) | * | |
| Total Expenses | 62,770 | 7,997 | 66,992 | 100,581 | 23,229 | 26,807 | 25,974 | * | 364,350 | |
| Surplus / (Deficit) | ($21,282) | $2,593 | ($10,519) | $44,677 | ($23,229) | $13,943 | ($10,974) | ($4,791) | ||
4. Map the results
Once these steps are done, you can map each business line on a grid. We put impact on the vertical axis (x axis) and profitability on the horizontal axis (y axis).
Here you see the Excel worksheet:
| Our Youth Community Organization Matrix Map Data | |||
| Business Lines | Profitability | Mission Impact | Expenses |
| After school tutoring | ($21,282) | 3.85 | $62,770 |
| Sports league | $2,593 | 3.25 | $57,997 |
| Summer programming | ($10,519) | 3 | $66,992 |
| Community festival | $44,677 | 2.6 | $100,581 |
| Job placement services | ($23,229) | 2 | $23,229 |
| Individeul donations | $13,943 | 1.5 | $26,807 |
| Community theater | ($10,974) | 1.8 | $25,974 |
| -4,791 | 364,350 |
Then using Excel’s chart function, select “Bubble Chart” to create the Matrix Map seen at the beginning of this article.
More than just a picture, though, the Matrix Map can help engage board members in strategic discussions about how to strengthen the organization’s business model – understanding that the implications of their decisions will affect both impact and finances. And staff can see the whole organization at a glance in a way that focuses attention on activities and impact rather than as an organization chart.
Also see:
- Part two of this Matrix Map discussion, Strategic imperatives for each business line
- Deconstructing “Sustainability”
- Strategic Planning: Failure and Alternatives
You might also like:
- The Case for Revenue-Led Budgeting
- Creating A Board That Works
- I Wanted to Be the Cool Boss — and Almost Destroyed My Organization
- Do Nonprofits Pay Taxes? Do Nonprofit Employees Pay Taxes?
- How to Stop Managing Your Nonprofit and Start Leading
You made it to the end! Please share this article!
Let’s help other nonprofit leaders succeed! Consider sharing this article with your friends and colleagues via email or social media.
About the Author

Steve Zimmerman, CPA, MBA, is principal at Spectrum Nonprofit Services, a finance and strategy consulting firm based in Milwaukee. With Jeanne Bell and Jan Masaoka, he co-authored Nonprofit Sustainability: Making Strategic Decisions for Financial Viability, published by Jossey-Bass in 2011. In addition to writing the Finance & Strategy column for Blue Avocado and consulting to nonprofits across the country, Steve conducts train-the-consultant sessions how to use the book’s framework with nonprofits in strategic and/or business planning. His site includes templates and other materials based on the book.
Articles on Blue Avocado do not provide legal representation or legal advice and should not be used as a substitute for advice or legal counsel. Blue Avocado provides space for the nonprofit sector to express new ideas. The opinions and views expressed in this article are solely those of the authors. They do not purport to reflect or imply the opinions or views of Blue Avocado, its publisher, or affiliated organizations. Blue Avocado, its publisher, and affiliated organizations are not liable for website visitors’ use of the content on Blue Avocado nor for visitors’ decisions about using the Blue Avocado website.
The charts are hard to see 🙁
The charts are hard to see 🙁
Sorry about the charts. If you would like some more information or clarification on anything posted here – please email us at MatrixMap@spectrumnonprofit.com. Thanks for comment!
Sorry about the charts. If you would like some more information or clarification on anything posted here – please email us at MatrixMap@spectrumnonprofit.com. Thanks for comment!
I’m going to send this out to my Board today as we prepare for our Strategic Planning retreat. We have been using a very similar tool but I like your explanation of impact.
I’m going to send this out to my Board today as we prepare for our Strategic Planning retreat. We have been using a very similar tool but I like your explanation of impact.
This is a great matrix. We did a similar exercise 2 years ago, but if we’d had this format it would have helped everyone understand things more easily. Thanks for sharing!
This is a great matrix. We did a similar exercise 2 years ago, but if we’d had this format it would have helped everyone understand things more easily. Thanks for sharing!
Very interesting We will have a board meeting tomorrow and I will present this matrix to them. Dr. Ofelia Dirige President & CEO Kalusugan (Good Health) Community Services San Diego County, National City, CA
We'd love to hear how it goes! Our email address for the map is matrixmap@spectrumnonprofit.com. thanks!
My thought, as we go into planning for next fiscal year (july 1 start date) is that this is a great tool for the Finance Committee to work with and then submit to the Board as a whole for discussion of next year’s budget and planning. Thank you. The timing is excellent.
My thought, as we go into planning for next fiscal year (july 1 start date) is that this is a great tool for the Finance Committee to work with and then submit to the Board as a whole for discussion of next year’s budget and planning. Thank you. The timing is excellent.
I like the process and the visual of the charts – I do not understand the significance of the size of the “bubbles” or circles however. Do the larger circles indicate larger mission impact or is it more to do with the size of the program within the organization – or something else??
The larger the bubble, the larger the expenses of the business line. It helps show the relation between profitability and expense for the program. Let us know if you have any questions!
Great approach to an often elusive conversation about mission and impact!
Is the link “Read more>” supposed to take you to Part 2? If so, its not working.
Hmmmm. Here's another way to access the full article: https://www.blueavocado.org/content/matrix-map-approach-part-one-how-create-matrix-map
Is the link “Read more>” supposed to take you to Part 2? If so, its not working.
Hmmmm. Here's another way to access the full article: https://www.blueavocado.org/content/matrix-map-approach-part-one-how-create-matrix-map
The Matrix Map approach in part one of this two-part article adapted from the book he co-wrote with Jeanne Bell and Jan Masaoka
good luck
I’m the founder of a nonprofit that’s just starting. Is this map something we can use now or when we’ve been in business for a while? Thanks.
Celise Colston – Page One Literary Center (Phx, AZ)
I am trying to create this matrix map. My Matrix Map data looks identical to what you have displayed in this article, however when I try to create the bubble chart, my results are not coming out in four quadrants. The bubbles are also all the same size. According to the data that I have we do have programs that would fall into 3 of the 4 quadrants. What am I missing?
I am trying to create this matrix map. My Matrix Map data looks identical to what you have displayed in this article, however when I try to create the bubble chart, my results are not coming out in four quadrants. The bubbles are also all the same size. According to the data that I have we do have programs that would fall into 3 of the 4 quadrants. What am I missing?