Benchmarking and Analyzing Salaries: A Fast How-To
Analyze salaries by charting salary ranges, adding benchmark salaries, and two ways to review individual salaries.

Compensation is an ongoing strategic challenge in nonprofits, and simple tools are the ones we are most likely to use consistently.
Everyone’s heard of benchmarking and salary analysis, but what are some easy tools to use? This article is adapted from a chapter in The Nonprofit’s Guide to Human Resources by Jan Masaoka, to be published by Nolo Press in the fall of 2011.
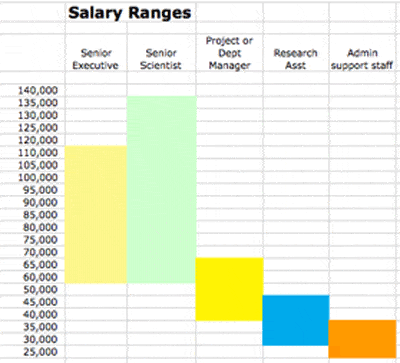
To illustrate ways to analyze salaries, let’s look at a simplified example of an environmental research organization. First we’ll chart salary ranges, then add benchmark salaries, and then look at two ways to look at analyzing individual salaries.
The five salary categories in this fictitious organization:
- Senior Executive: Members of the management team and department heads. Salary range $60,000 to $110,000.
- Senior Scientist: Principal investigators who bring in and direct major research projects. Salary range $60,000 to $140,000
- Project Manager: Manages a smaller scale scientific project or administrative area of responsibility, or has substantial responsibilities under a senior scientist or senior executive. Salary range $40,000 to $65,000
- Research Assistants. Salary range $30,000 to 45,000
- Administrative Staff. Support staff. Salary range $26,000 to $39,000
This organization shows wide ranges for senior scientists, especially compared with the ranges for administrative support staff. This is typical for nonprofits, and usually reflects the reality that senior positions encompass a wide range of skill and experience. In addition, individuals who bring in restricted funds — through grantwriting or earned income — are often also the project managers for those funds. In this case, for example, senior scientists bring in grants for projects on which they will be the principal investigators.
For each range, you establish (particularly with wide ranges), be sure to identify the
 assumptions and variations that are the rationales for paying at the high, low or mid end of the salary range. Charting the ranges gives a management team and the board a tool for determining whether salary spreads are appropriate to the multiple goals of attracting top talent, internal balance, and affordability.
Benchmarking salaries
To begin a benchmarking process, choose a few positions in your organization that you can compare to other organizations of your type and size. In an environmental research firm, these might be one from each category: the executive director position, a senior research biologist, a research assistant, and the office manager. Then you can find environmental organizations with similar revenue and compare those salaries to yours.
For some positions, like a senior scientist job, it may also be useful to benchmark the salary against similar positions in state and local governments. In other cases where you are competing with the for-profit sector, looking at salaries in small, for-profit firms may be appropriate.
Some ways to find comparable salaries:
- Many local nonprofit surveys are produced; ask around to find ones in your area.
- National nonprofit salary surveys are conducted by a variety of nonprofit and for-profit firms including Opportunity Knocks, Economic Research Institute, Abbott Langer and ASAE, with varying fees. National surveys often have samples that are too small when selected for field and geogrphy to be useful for individual salary comparisons.
- Salary data is included on Form 990 for employees with salaries of $100,000 or more and are available at Guidestar. Choose several in your area and look in Part VII of their 990s.
- Group-based: Go to the coalitions, consortiums and associations you belong to (such as youth symphony orchestras or domestic violence shelters) and ask if everyone will agree to give their salary data to a third party who will compile it and report it back with organizational names deleted. If you don’t belong to such a group, approach four or five organizations you know a
You also want to take into account your geographic location in choosing what organizations to use as benchmarks. Try to find similar cost of living locations or take cost of living into account when making your comparison. Don’t expect salaries in Des Moines to match those in New York City even if organizations in both places do similar work.
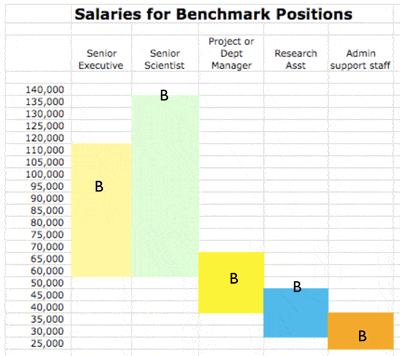
Here is the same chart as the one above, with the median salaries for the benchmarking organization shown with the “B” showing where the benchmark salaries fall:
Charting like this allows you to analyze competitiveness. This chart shows that the organization is highly competitive for the senior executive, project or department manager, and support staff positions but less competitive for the senior scientists and for research assistant positions.
There could be many reasons for these discrepancies, including the level of scientific work required of the senior scientists or the type of research expected of research assistants. But it may also be that your organization has simply fallen behind on salaries. Doing a chart like this allows you to get a snapshot of where you are and then you can dig in and do the analysis you need based on what you find.
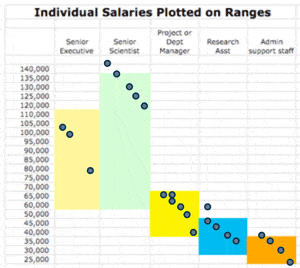
You can also chart the salaries of individuals in your organization. The benchmark salary information has been removed from this chart; this is just the salary ranges for positions and the actual salaries paid in each category.
In this example, there are three people who are paid above salary range. As an accountability matter, look into the particulars. For example, were these salaries approved by management, and if so, on what basis?
If salaries seem to be clumped at the top end of a range, again you will want to find out why. Is it because the people in those jobs have a lot of tenure? You will probably want to think about whether that range needs to be raised or whether you need to let some staff know that they are reaching the top of the range so that they have realistic expectations about their future salary growth.
Management team members will appreciate salary data presented this way in addition to a more typical salary schedule. The information is primarily useful for analyzing overall compensation strategies although supervisors also will appreciate knowing where a given employee fits in the range for a given position. You can prepare individual salary information as follows:
 This article is certainly not a comprehensive overview of salary analysis in nonprofits. But these simple mapping tools will go a long way towards helping senior leadership and the board think about compensation as a whole, as well as with individuals. Compensation is an ongoing strategic challenge in nonprofits, and simple tools are the ones we are most likely to use consistently.
Photo credit: tlang
See also:
You might also like:
- When the Board Becomes the Problem: Reclaiming Power in Nonprofit Leadership
- Why Human-Centered AI Adoption Matters for Nonprofits
- The New Sheriff in Town: Tips for Successfully Leading a Nonprofit Team (that Someone Else Built)
- When the System Fails Quietly: What I’ve Learned from Sitting Between the Frontline and the Data
- A Board Member “Contract”
You made it to the end! Please share this article!
Let’s help other nonprofit leaders succeed! Consider sharing this article with your friends and colleagues via email or social media.
About the Author
Jan is a former editor of Blue Avocado, former executive director of CompassPoint Nonprofit Services, and has sat in on dozens of budget discussions as a board member of several nonprofits. With Jeanne Bell and Steve Zimmerman, she co-authored Nonprofit Sustainability: Making Strategic Decisions for Financial Viability, which looks at nonprofit business models.
Articles on Blue Avocado do not provide legal representation or legal advice and should not be used as a substitute for advice or legal counsel. Blue Avocado provides space for the nonprofit sector to express new ideas. The opinions and views expressed in this article are solely those of the authors. They do not purport to reflect or imply the opinions or views of Blue Avocado, its publisher, or affiliated organizations. Blue Avocado, its publisher, and affiliated organizations are not liable for website visitors’ use of the content on Blue Avocado nor for visitors’ decisions about using the Blue Avocado website.


I kind of like this. If we did something like this we could easily figure out salaries for new positions and for the cost allocation thing we have to do.
Falls in line with research I have done.
Jan, this is very helpful, but might be even more so with some guidance about how the salary ranges scale to overall organization size (budget).
Regards
Helpful, but this is a very labour intensive process to undertake! Thankfully in Canada a survey was done by the Cultural Human Resource Council that is very comprehensive.
The graphing style is very helpful, especially for those who’s eyes glaze over at an excel spreadsheet.
I’d like to add one caveat about choosing the correct benchmark ranges though. Being in a large general category and having a similar sized budget doesn’t mean that the organizations are comparable to your own. Someone not having a well-rounded view of our organization’s programs and structures compared it with several others with far fewer programs and expectations when looking at exec ranges. So, in addition to being very diligent about understanding the job demands of your own organization and others, it’s also good to remember that other organizations may actually not be paying their own people appropriately.